
Data Collection and Visualization for Bridging the Digital Divide
Summary
My internship with XRI Global involved contributing to the Bridging the Digital Divide project, which is dedicated to assessing the data available for low-resource languages and putting together a database that could be accessed through a web-based application to make it easier for researchers to find what data is currently out there. It focused on machine translation data, automatic speech recognition data, and LLMs.
I was tasked with various jobs, including gathering machine translation data for low-resource languages to split them into train/dev/test sets, grammar proofing an OCR document on Kanuri, going through the No Language Left Behind model to put together a .csv file on the language pairs they offer, and cleaning up datasets that had been scraped from Hugging Face. I also spent time on data visualization to prepare for our team to present our current progress on the project at the LT4All 2025 (Language Technologies for All) conference held at the UNESCO Headquarters in Paris during February 24-26, 2025. Collaboration with fellow interns working on the project was essential to coordinate between related tasks effectively, and being able to work on a project in a field relevant to my interests in both human language technology and equity was a rewarding experience.
Data Collection and Processing
I was instructed to collect data from Hugging Face. The first few weeks of my internship were spent collecting data for various African languages, such as Twi, Hausa, and Igbo, and making the formatting uniform across datasets.
While I learned in my courses how to convert files from one file type to another, it was my first time encountering the .parquet file type. Using pandas, I converted the data from .parquet files and .tsv files into .json files to be read for machine translation training.
For example, I wrote the following code to convert a .tsv file into a .json file for a dataset for machine translation of English to Kinyarwanda:
import pandas as pd
df = pd.read_csv("en-rw.tsv", engine="python", sep="\\t")
json_data = df.to_json(orient="records")
with open("en-rw.json", "w") as f:
    f.write(json_data)
I also wrote the following code to convert a .parquet file into a .json file for a dataset for machine translation of Amharic to English:
import pandas as pd
df = pd.read_parquet('validation-00000-of-00001.parquet', engine='fastparquet')
df.to_csv('am-en_dev.csv')
df = pd.read_csv(r'am-en_dev.csv')
df.to_json(r'am-en_dev.json')
This data was already uploaded in the form of train/dev/test sets, so I did not have to split them. However, I was already familiar with the concept of splitting data into train/dev/test sets from my courses and had experience with it for a couple of course projects. XRI Global also taught me about other considerations to make when organizing data. It was important to balance granularity and practicality when organizing the data; although we wanted to keep the datasets somewhat domain-specific, we also did not want to end up having to train several different models. As a result, we were advised to keep the current granularity but be flexible with how to split the data when the time came for training.
I also spent time assisting another intern with manually filling in information about the machine translation datasets he scraped from Hugging Face that could not be automatically done with code. This included labeling what type of data it was, such as monolingual or multilingual, and submitting missing documentation on Hugging Face itself about the languages contained in the dataset.
During my couple of weeks grammar proofing the OCR document about Kanuri to help XRI Global assess the quality of different OCR models, I noted any patterns in the mistakes the OCR version had compared to the gold version and provided a corrected copy.
Near the end of my internship, I was tasked with assisting another intern in finding more datasets, this time for automatic speech recognition, which I would then split into train/dev/test sets like I did with the machine translation data. This posed different challenges than the machine translation data did, as the audio data required more processing than the machine translation data did. For example, the audio files had to be .wav files with uniform lengths of 30 seconds. These constraints were determined by the intern who led the task. To meet the time constraint, I used pydub:
from pydub import AudioSegment
from pydub.utils import make_chunks

def trim_length(input_path):
    audio = AudioSegment.from_file(input_path, format="wav")
    return(make_chunks(audio, chunk_length=30000))
If the format of the file was mp3, then I would change format="wav" into format="mp3". Then, after using the function to break the audio file into 30-second chunks, I exported each chunk as a .wav file:
for i, chunk in enumerate(chunks):
    file_name = f"chunk_{i}.wav"
    chunk.export(file_name, format="wav")
Though I have taken a course that worked with sound files, I was not familiar with the pydub library. However, I was originally not familiar with many of the libraries I was required to use in my courses. The experience I gained from reading the documentation for those libraries in order to understand and complete my assignments made navigating the documentation for the pydub library and learning how to implement it easier.
Data Visualization
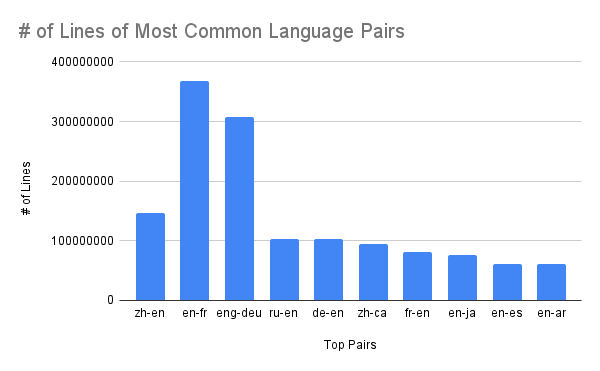
To prepare for the UNESCO conference in Paris, I analyzed the machine translation data we had collected and made graphs to show points of interest, such as the most common language pairs and the least common language pairs. I also made graphs to show how many datasets there were for each language pair, but upon realizing that each dataset varied widely in how much data they contained, I made more graphs to compare how many actual lines of data there were for the most common language pairs, as they would give a more accurate idea of how much data was available.
Because the scraped data from Hugging Face contained thousands of datasets, I had to find a way to compile datasets of the same language pairs efficiently. Since I was provided a copy of the data in Google Sheets, I used the QUERY function to add together the line counts for datasets that were listed as having the same language pairs:
=QUERY({'charts for line counts'!I:J},
"SELECT Col1, SUM(Col2)
WHERE Col1 IS NOT NULL
GROUP BY Col1
ORDER BY Col1
LABEL Col1 'Language Pair', SUM(Col2) 'Total # lines'",0)
The 'charts for line counts' was the name of the tab in the spreadsheet containing the relevant data, column I contained the language pairs, and column J contained the line counts.
I also made graphs for the number of lines of data there was for the most common source languages and most common target languages.
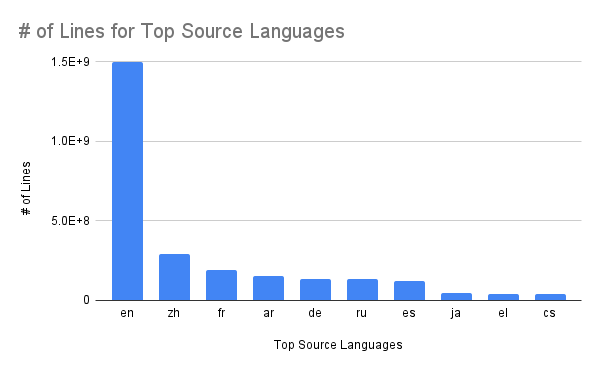
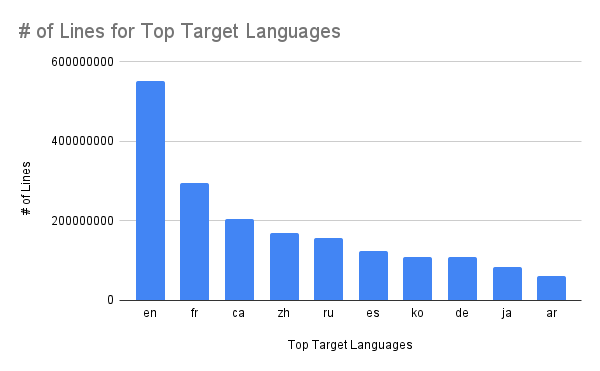
Lastly, I made graphs comparing the continental distribution of the 10 most commonly spoken languages compared to that of the top 10 languages with the most data available, the continental distribution of the top 10 language pairs, the continental distribution of the top 10 source languages, and the continental distribution of the top 10 target languages.
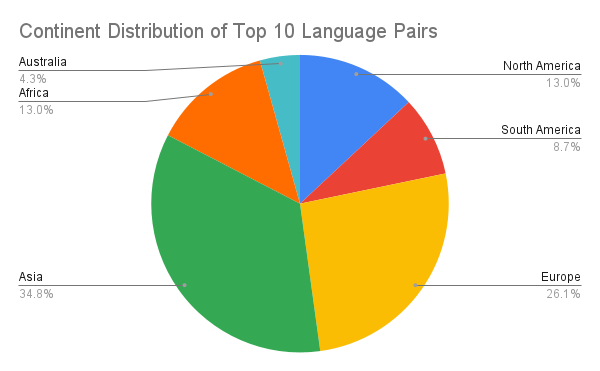
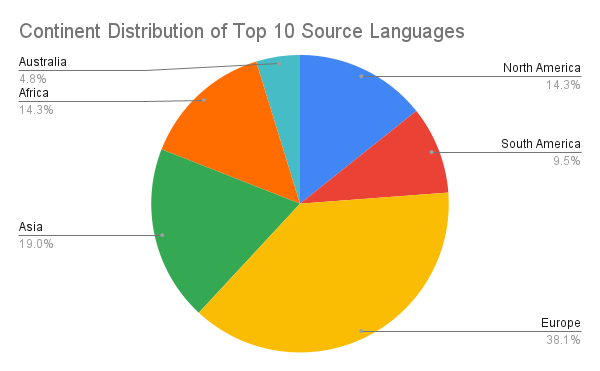
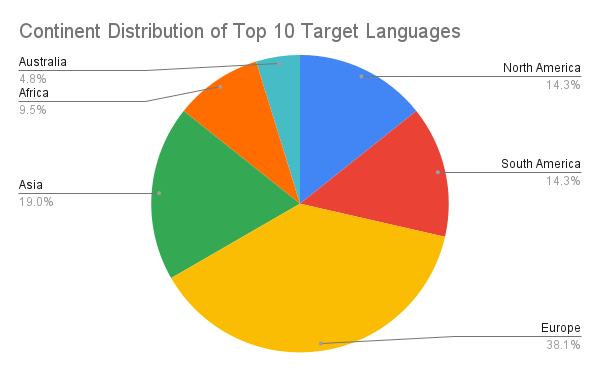
However, it was later decided that we would display the project website instead of a poster at the conference, so my graphs went unused. Nonetheless, the conclusions that could be drawn from the graphs may provide insight on what languages and regions to focus on in the future to further close the digital divide. For example, the graphs show a bias towards languages in Asia and Europe, suggesting that indigenous languages in Africa, Australia, and the Americas would benefit from more attention.
During this task, I found that a major difficulty in organizing and analyzing the data was the lack of standardization in formatting. Thus, after the conference, I spent a few weeks making a .csv file that would standardize language codes. The collected machine translation datasets had various ways of formatting the languages they contained, such as different versions of ISO codes as well as suffixes specifying script type. I went through the data collected and made a table so that future data could be standardized more easily by using the table to map different language codes to one standard.
LT4All 2025 Conference
In the last week of February, I attended the LT4All 2025 conference in Paris with three other interns to present the current progress of the project and learn about current developments in language technology research. For the conference, we submitted an abstract in English and French. The project website was a work-in-progress, but we were able to convey that it was to become a database listing current available resources for low-resource languages. This included a map of what languages have available data and some statistics about the data available for those languages, such as their BLEU scores. Various conference attendees expressed interest in the project and how they would like to share data they have to contribute to the project. We shared contact information with attendees and encouraged them to share the website with peers who might also be interested in contributing their data. Multiple attendees expressed how they had not seen a database like this, dedicated specifically towards low-resource languages, before.